~5 minute read
By Steve Virkler (Wealth Manager) at Life Financial Group
Originally shared on the Life in the Markets podcast — 10/19/2026
Subscribe on Apple Podcasts or Spotify.
*Note: you will get the most out of this market update by watching the video above*
Inflation came in hotter than expected in September, and two reports told the story: the CPI and the PPI. But what is the difference between CPI vs PPI, and why should you care? In this post, we’ll explain what each report measures, what the latest numbers showed, and a few practical steps you can take with your budget and savings.
CPI vs PPI: What’s the Difference?
Both reports are produced by the Bureau of Labor Statistics, and both track prices. The difference is where in the economy they look.
The Consumer Price Index (CPI) measures the average price of a basket of goods and services that everyday consumers buy. It’s based on data from about 24,000 consumers who represent a cross-section of the country: people in rural and urban areas, employees and the self-employed, and lower- and higher-income households. The CPI is the most common way to track inflation for the average consumer.
The Producer Price Index (PPI) tracks the wholesale prices that domestic manufacturers and businesses receive for their products and services. In other words, it measures costs before they reach store shelves.
That’s why the PPI is considered a leading indicator. When producers pay more, those costs often show up in consumer prices later.
What the September Reports Showed
The CPI report showed annual consumer inflation rose to 3.7% in September, up from 3.4% in August. That was higher than many economists expected.
The PPI report caused an even bigger stir. Wholesale prices jumped 1.3% in a single month, more than double the 0.6% analysts expected. Over the past year, producer prices are up 6.3%, the fastest pace in more than four years. Core PPI is up 5% over the past 12 months.
A surge like this suggests manufacturers are facing higher costs, especially for energy. That leaves companies with a tough choice in the coming months:
- Absorb the higher costs and accept smaller profit margins
- Pass the costs on to consumers, which would keep the CPI elevated
Why Gas Prices Are Driving Inflation
Gasoline prices rose 9.1% in September and accounted for more than half of the CPI’s jump.
When the war began, Iran closed off the Strait of Hormuz, and oil prices spiked. Shipments have since recovered to prewar levels, but prices have stayed high because countries that drained their reserves during the disruption are buying up the extra supply.
As of Friday, Brent crude was trading above $110 per barrel, about 53% higher than in February. According to AAA, gasoline averaged $4.33 per gallon nationwide, up from $2.98 before the war. Diesel was $6.33 per gallon, just below the record it set in September.
There is some good news. Goldman Sachs expects Brent crude to average $90 by the end of the year and about $80 in 2027, as long as the conflict doesn’t flare up again.


What It Could Mean for Interest Rates
When producer prices rise sharply, central banks often respond by raising interest rates. That makes a Federal Reserve rate hike more likely.
The next Fed meeting is October 27-28. Most analysts expect any increase to come at the December meeting, but we’ll be watching closely.
What Sticky Inflation Means for Your Budget and Savings
The general consensus is that inflation may stay “sticky” until early next year. Here are a few steps that can help in the meantime:
- Revisit your budget. Persistent inflation makes a clear, up-to-date budget more important than ever.
- Keep a healthy cash reserve. Short-term savings give you flexibility when prices rise unexpectedly.
- Put your cash to work. As interest rates rise, high-yield savings accounts can offer stronger returns, so your savings keep pace.
A Quick Look at Last Week’s Markets
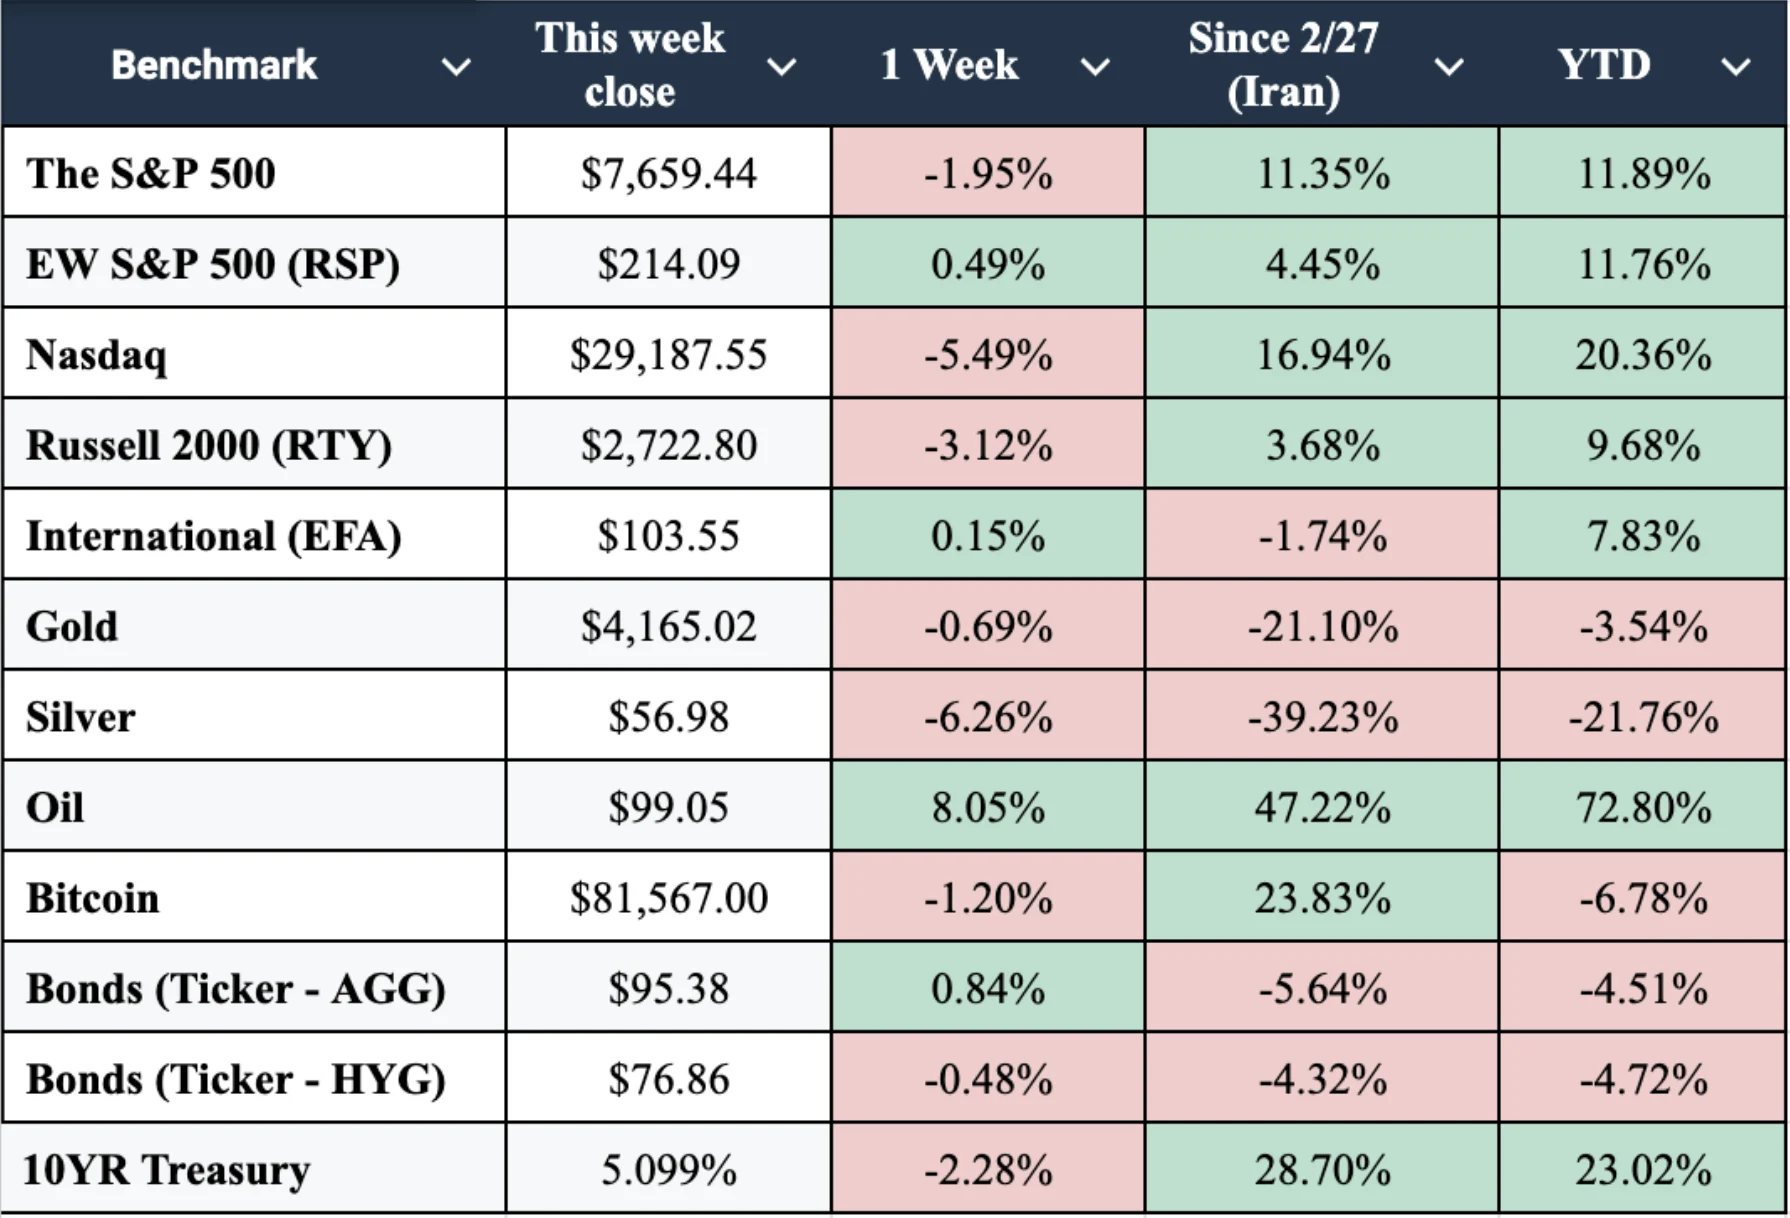
Inflation worries weighed on stocks last week. The Nasdaq Composite fell 2.1% on Friday and finished the week down about 4.5%, ending a four-week winning streak. The S&P 500 fell 1.1% on Friday and 1.95% for the week, its fourth weekly decline in six weeks. Even so, the S&P 500 is still up just under 12% for the year.
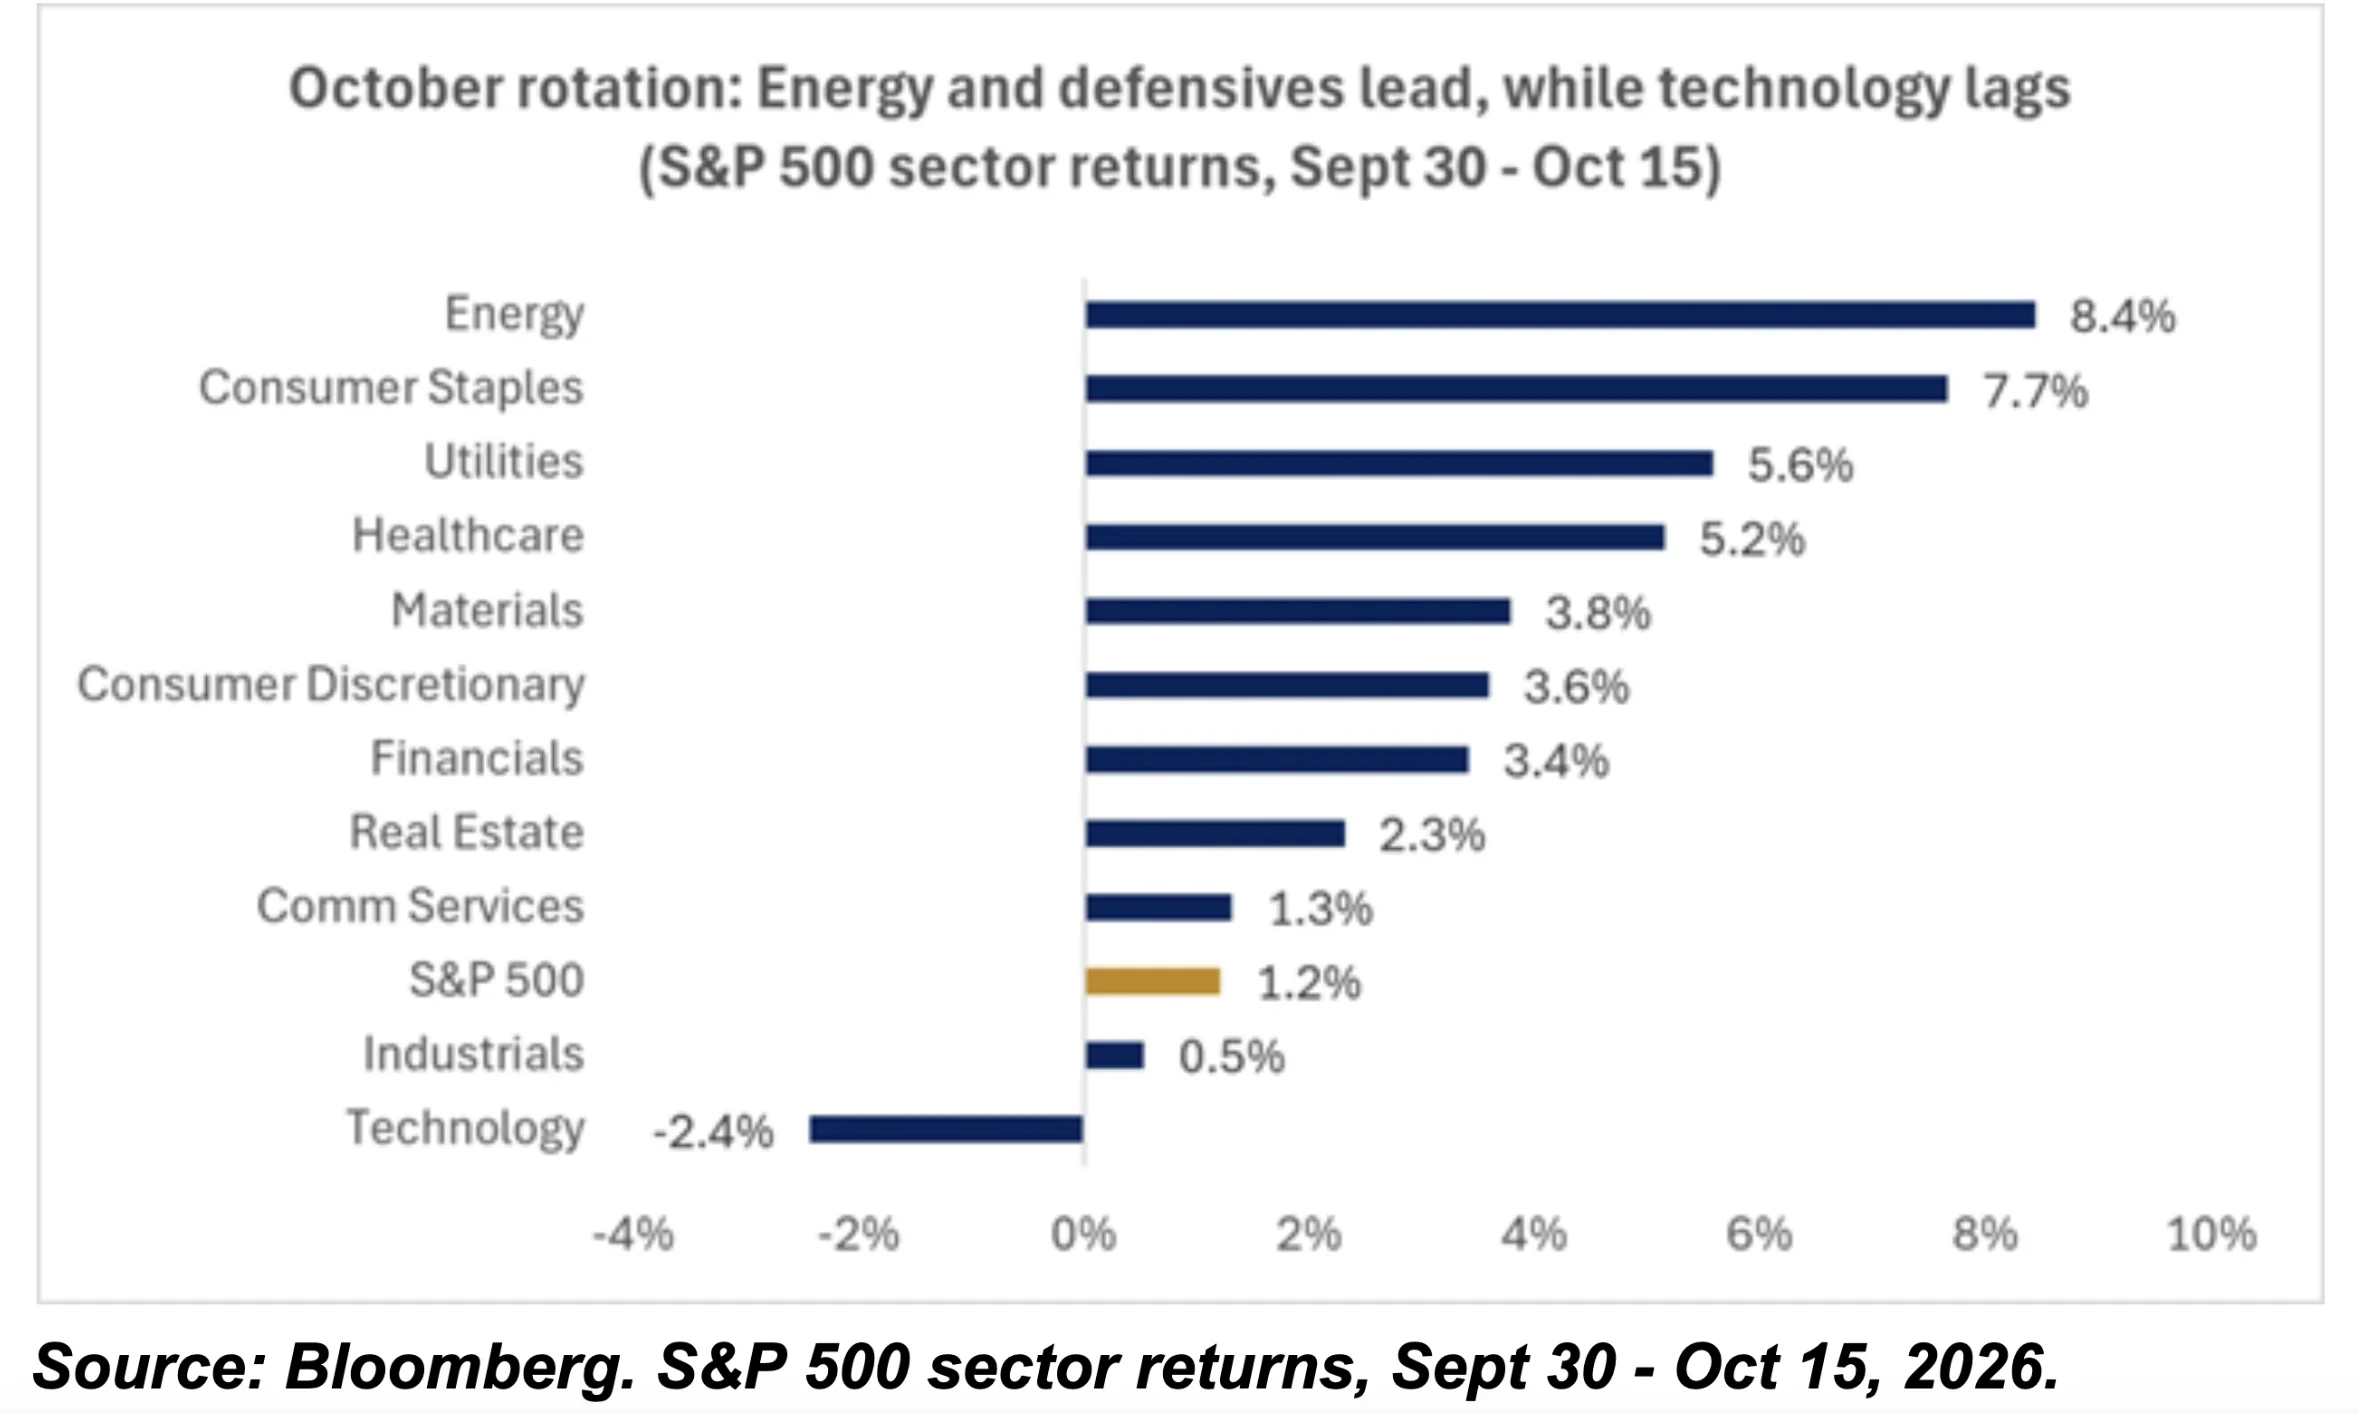
We’ve also seen a shift in market leadership this month. Energy and consumer staples have led since the start of October, while technology, despite being up more than 20% year to date, has been the worst-performing sector. Two factors are behind that: concerns that AI revenue isn’t keeping up with high expectations, and higher interest rates affecting companies that rely on debt financing.
Verse of the Week
Proverbs 27:23 says, “Know well the condition of your flocks, and give attention to your herds.” In uncertain times, let’s be diligent in being the best stewards we can be of all that God has entrusted to us.
Have questions about what this means for your own plan? Reach out to our team, we’re glad to talk it through.
Stay Connected
Have questions or topics you’d like us to cover in a future episode? Email us at contact@thelifegroup.org with “Life in the Markets” in the subject line.
✅ Like, comment, and subscribe on YouTube
🎧 Listen to the audio podcast wherever you get your shows
📘 Pick up a copy of The Good Steward to grow in your financial discipleship
Sources
- Reuters via CP24: Oracle triggers force majeure on data centre project
- DatacenterDynamics: Oracle issues force majeure notice to Blue Owl
- Techzine: Oracle seeks payment deferral if data center is not operational by 2028
Disclaimer: The topics discussed here are for informational purposes only and do not constitute specific investment advice. Investing involves risks, including potential loss of principal. Past performance does not guarantee future results. Securities and advisory services offered through Geneos Wealth Management, member FINRA/SIPC.