~5 minute read
By Stephen Rohrer, CES™ (Wealth Manager) at Life Financial Group
Originally shared on the Life in the Markets podcast — 10/12/2026
Subscribe on Apple Podcasts or Spotify.
*Note: you will get the most out of this market update by watching the video above*
Midterm elections and the stock market have had a surprisingly consistent relationship. Historically, markets have run cold in the months before a midterm election and warmed up in the year after. In this week’s episode, we look at what the history shows, why midterms tend to stir up uncertainty, and how to keep that pattern in perspective for your long-term plan.
Midterm Elections and the Stock Market
In most midterm election years since 1950, the market has seen a meaningful drawdown in the months leading up to Election Day, then a strong recovery in the year that followed.
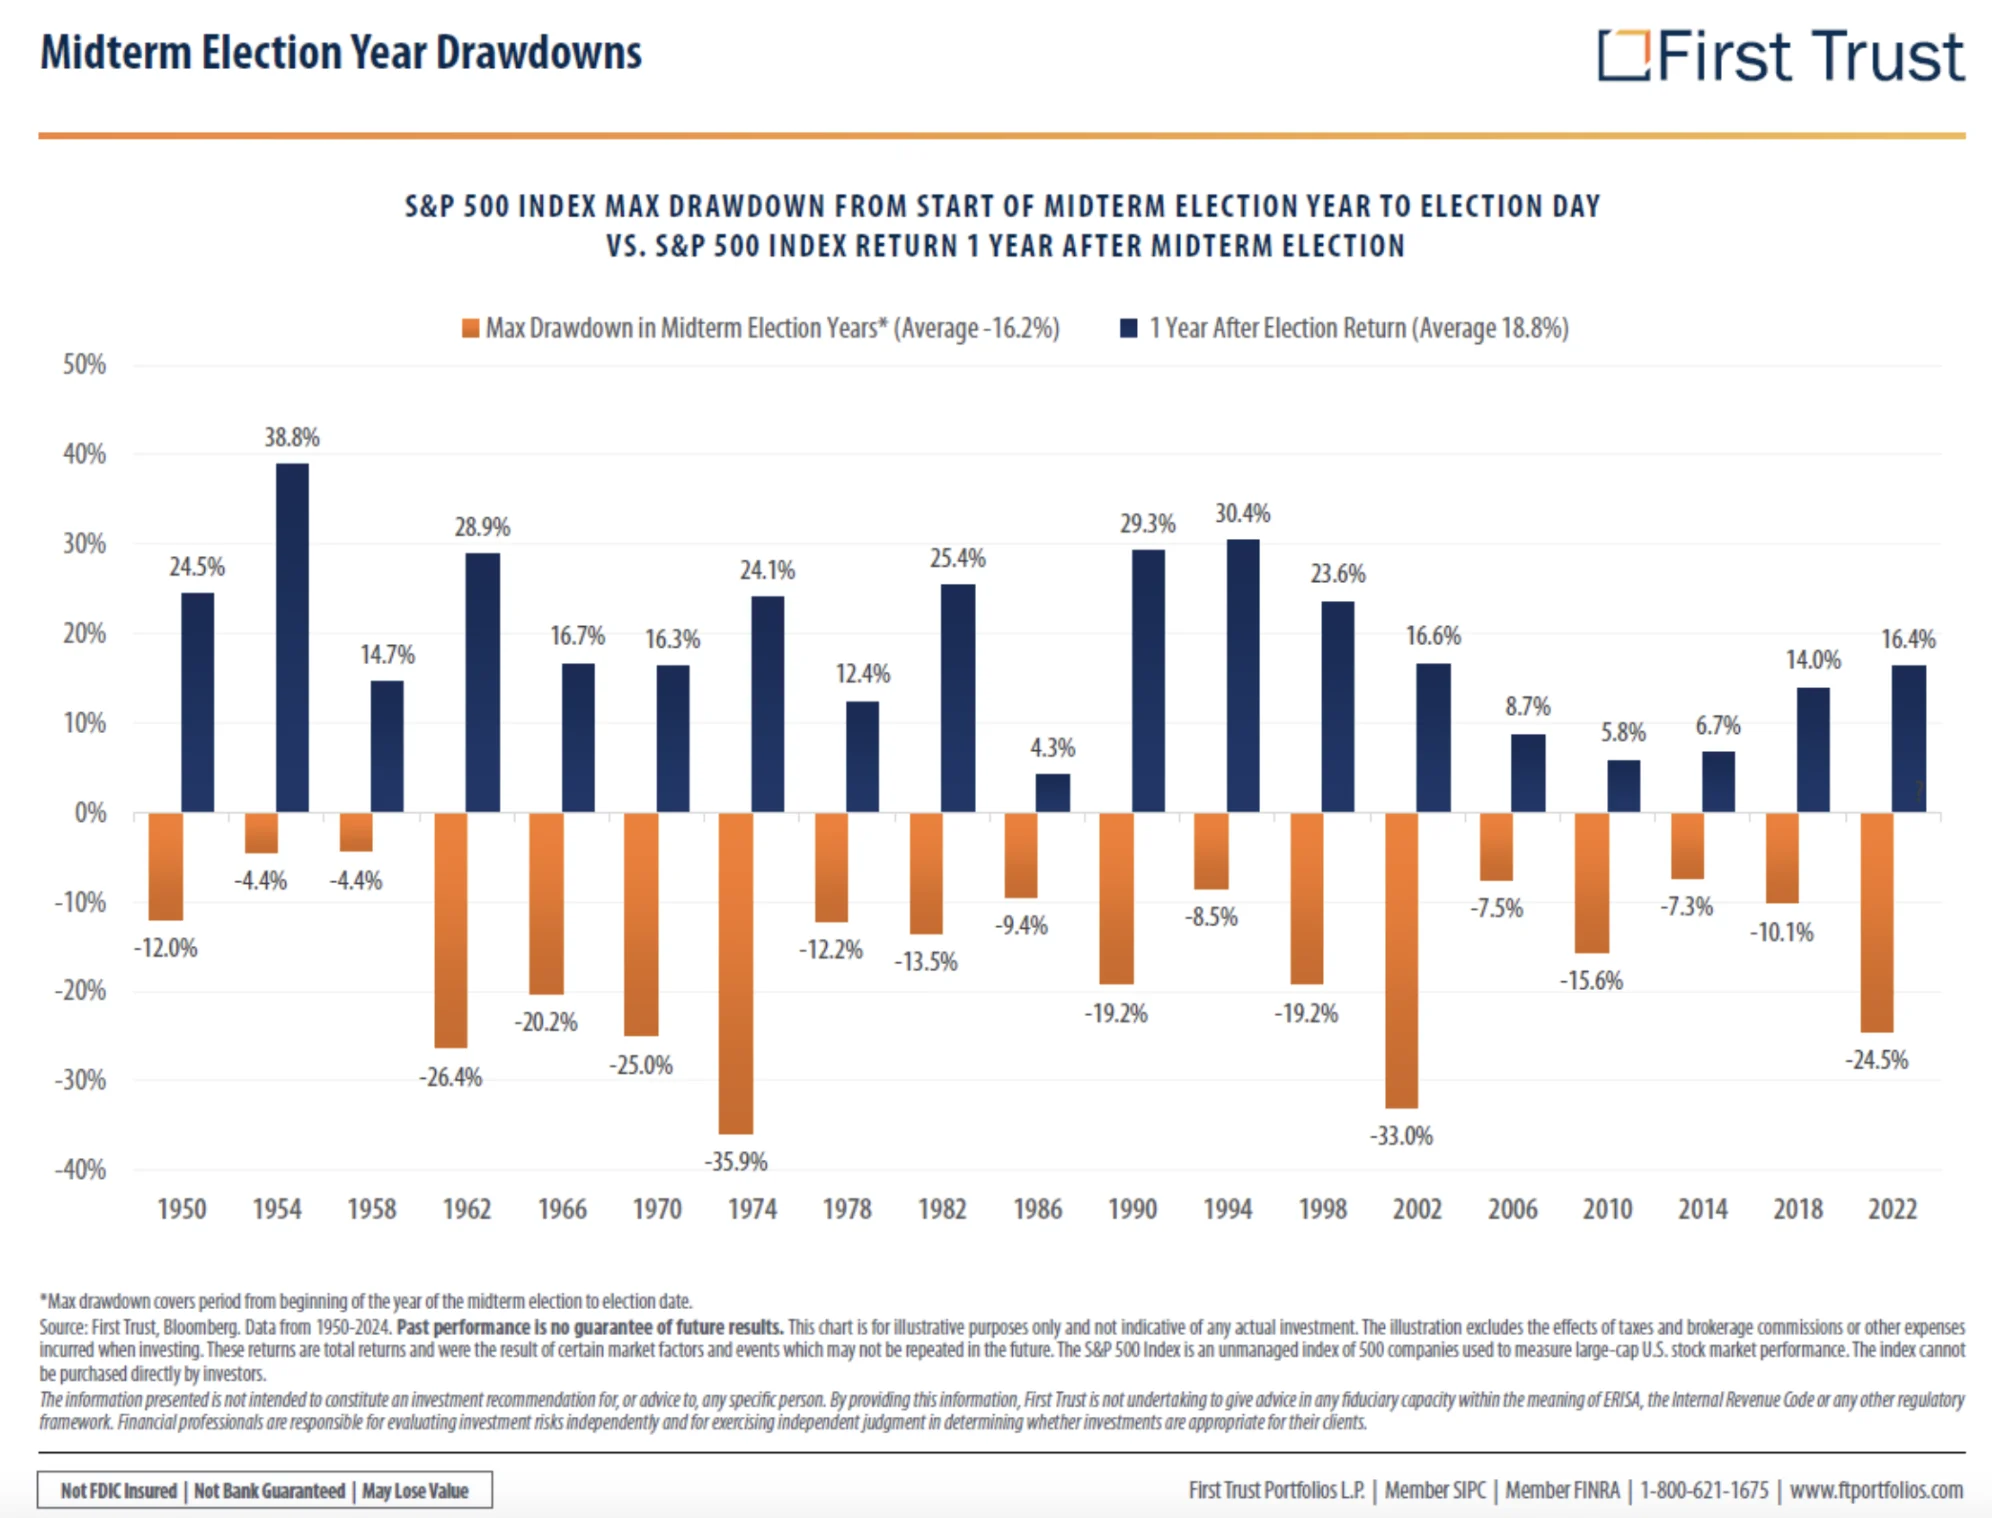
The orange bars in this First Trust chart show how far the market fell from its high to its low between January 1 and Election Day in each midterm year. Since 1950, that drawdown has averaged -16.2%.
The blue bars show the market’s return over the 12 months after each midterm election. That average has been +18.8%.
Drawdown vs. Return: What the -16% Really Means
A drawdown is not the same as a loss for the year. A drawdown measures the drop from the market’s high to its low within a given period.
So a 16% average drawdown means that, somewhere between January 1 and Election Day, the market typically fell about 16% from a peak to a trough. It does not mean the market was down 16% for the year on Election Day.
Why Markets Get Nervous Before Midterms
One of the things markets dislike most is uncertainty. Midterm elections bring questions about the direction of government policy back to the forefront.
That’s true even though midterms often lead to political gridlock. The sitting president’s party usually loses seats in the House, which often limits the president’s ability to keep advancing his agenda. Less change should mean less uncertainty, but the market still tends to react to the unknown before the votes are counted.
Market Volatility Through the Presidential Cycle
Because of that uncertainty, volatility has often increased on the way to midterm Election Day, then declined over the following 12 months.
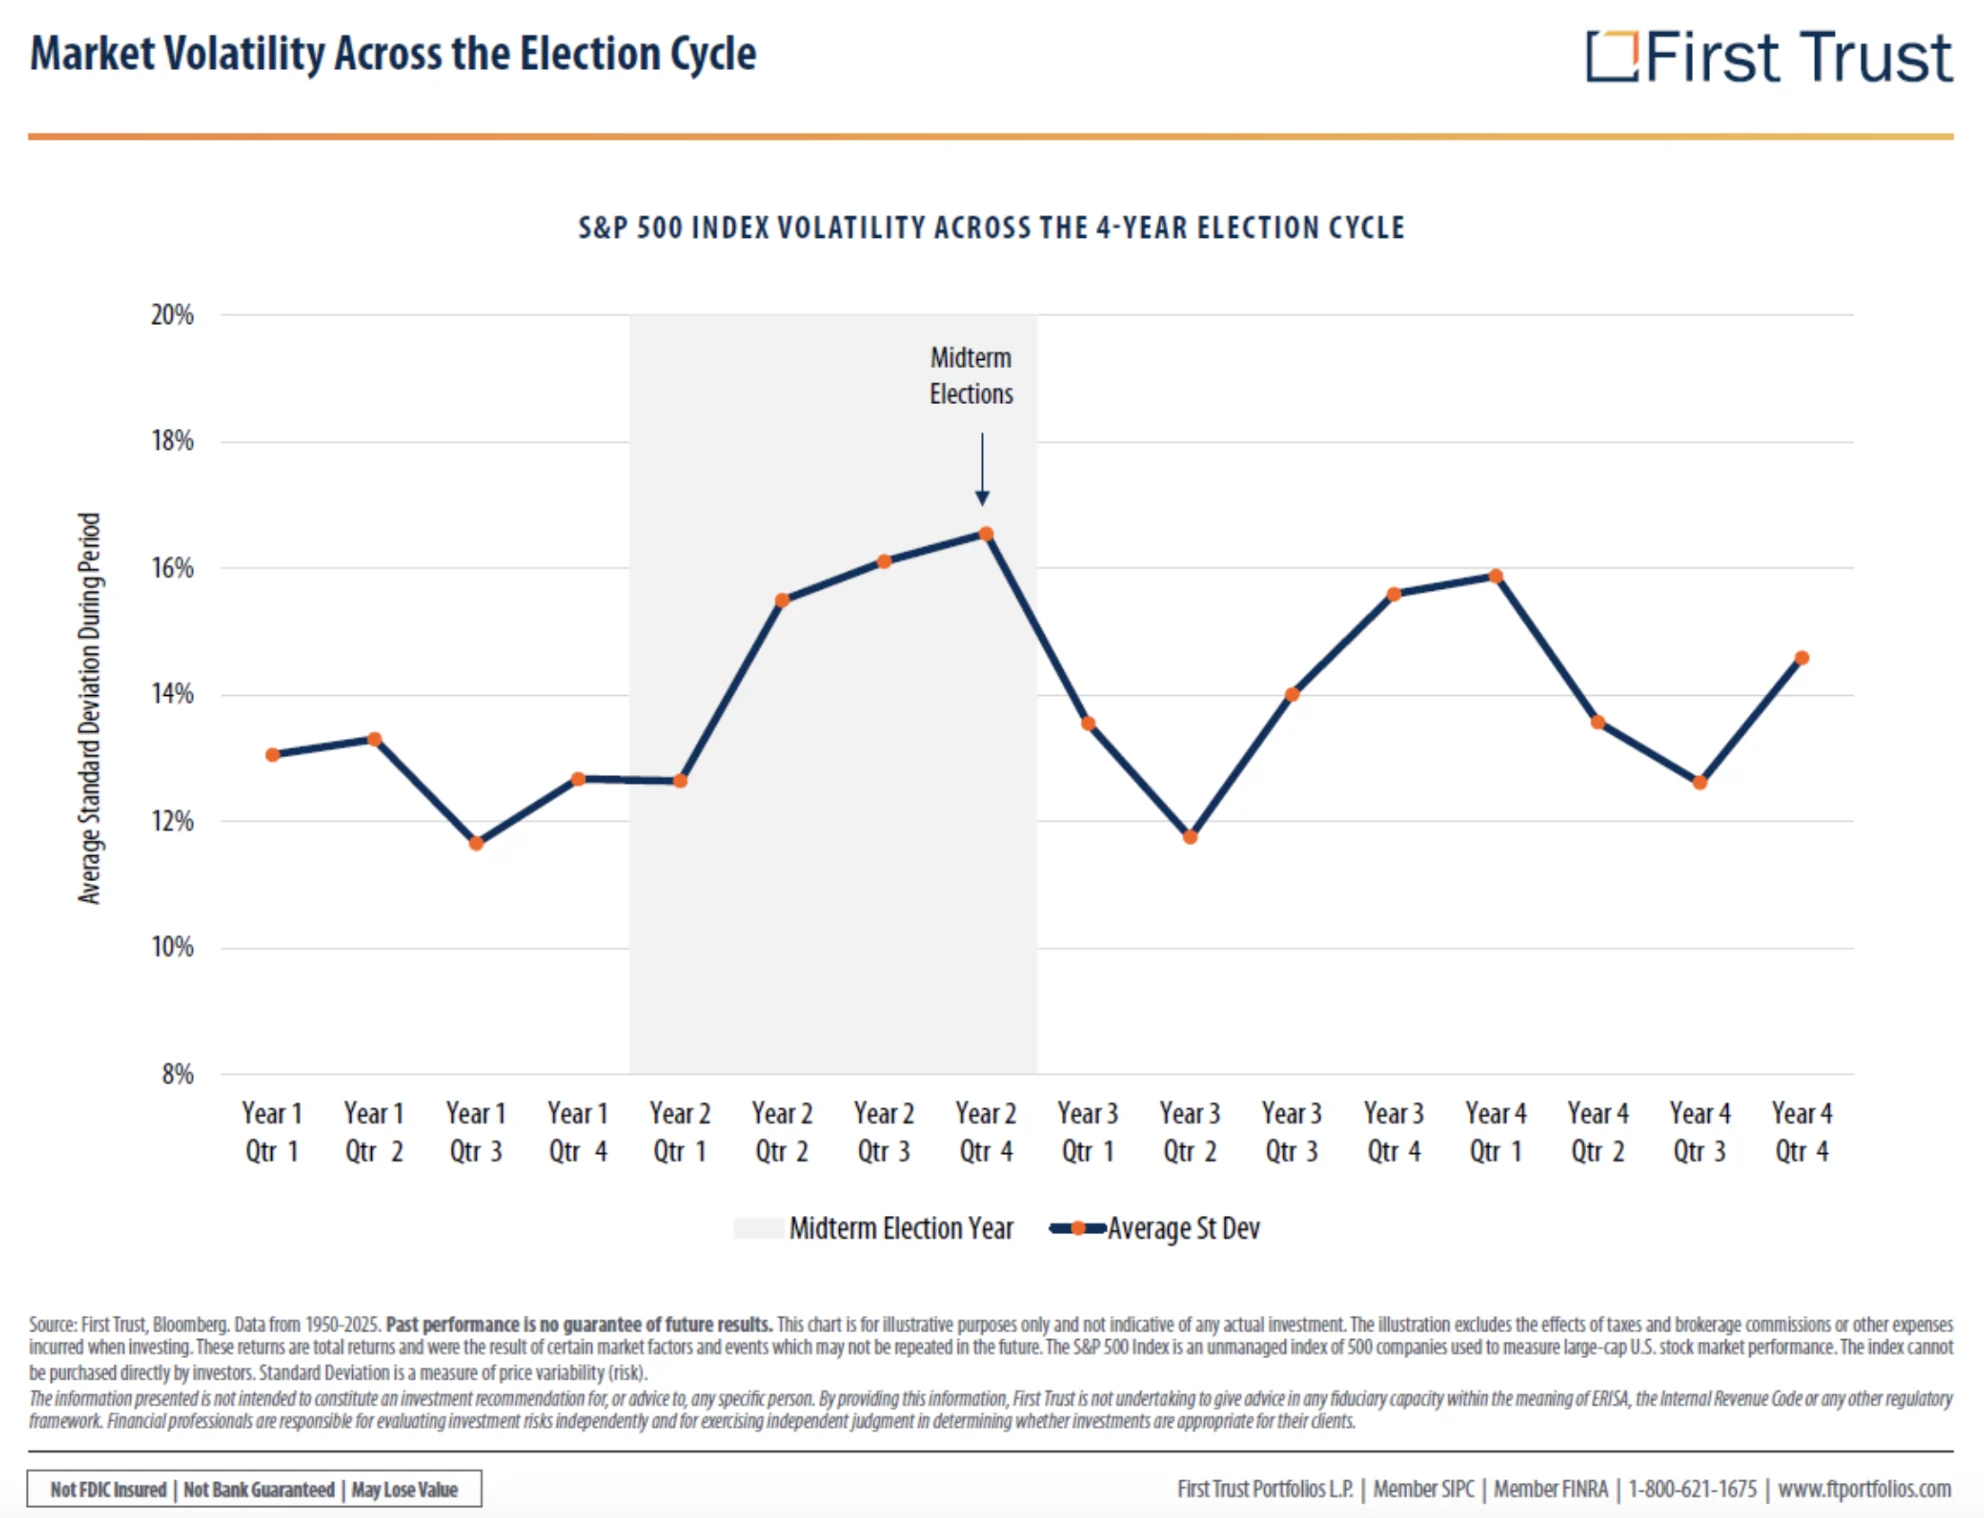
Here’s how to read this chart:
- Horizontal axis: the four-year presidential cycle, by quarter. It starts in the first quarter after a president takes office and runs through the lead-up to the next presidential election.
- Vertical axis: volatility, measured by standard deviation. The higher the line, the more volatile the market.
On average, the market has been even more volatile heading into a midterm than heading into a presidential election. That may seem unwarranted, since midterms usually bring less change and more gridlock. But historically, the market has bucked and bounced its way to Election Day.
After the election, the picture tends to change. Reduced regulatory uncertainty and increased congressional gridlock have generally been followed by a fairly sharp drop in volatility over the next 12 months.
What This Means for Your Portfolio
Past performance is no guarantee of future results. The 12 months after this particular midterm could bring situations that aren’t reflected in the historical averages.
Still, the pattern is a useful reminder of how strongly markets react to the possibility of policy change, and how often that worry has faded once the uncertainty is resolved. For long-term investors, staying invested and not getting distracted by short-term noise has generally been the better course.
Have questions about how this applies to your plan? Schedule a conversation with our team.
Last Week in the Markets

Small and Mid-Caps Are Having a Strong Year
As of October 2, the S&P SmallCap 600 was up 16.3% for 2026, ahead of the S&P 500’s 13.79%. The S&P MidCap 400 has also kept pace. Even though gains leveled off somewhat in the third quarter, it has been a strong year for the broader market beyond the big tech and AI names.
Why the 10-Year Treasury Yield Is Up
The 10-year Treasury yield dipped late in the week but is up significantly for the year. One factor is heavy borrowing by large tech companies to fund AI capital spending.
Lessons From Past Technology Booms for AI
At a recent broker-dealer conference, a portfolio manager and principal at Strategic Equity Management compared the AI boom to past technology booms, from railroads and the telephone to the internet. They share similar markers:
- The early stage is chaos.
- Early leaders rarely become the long-term winners.
- Infrastructure comes first, and it takes enormous capital. Railroads needed track, and the internet needed undersea cables. For AI, the infrastructure is data centers.
- Productivity follows. In every boom reviewed, productivity eventually did rise sharply.
- Consolidation comes last. Some companies fail simply because of timing: the productivity gains don’t arrive soon enough to save them, even when the business model wasn’t flawed.
Two risks stood out for AI specifically:
- Short-lived assets. Assets with less than a six-year lifespan make up about 60% of AI data center spending. Many chips are close to outdated by the time they’re installed, which means ongoing replacement costs on top of $600 to $800 billion in spending.
- Debt that’s hard to see. Some companies carry more debt than their published debt-to-equity ratios show, with lease commitments and other obligations disclosed only in the footnotes.
Will AI be a boom or a bust? Probably both. History suggests the productivity will come and there will be winners, but it’s hard to know in advance who they’ll be. That’s a reason not to let excitement drive concentrated bets on any one company.
What to Watch This Week
- Earnings: JPMorgan, UnitedHealth Group, and Taiwan Semiconductor report third-quarter results.
- Inflation data: On Wednesday, the Bureau of Labor Statistics is scheduled to release the September Consumer Price Index (CPI).
Verse of the Week
As we move into harvest season, with fall fests and apple festivals all around us:
“He who gathers in summer is a prudent son; he who sleeps in harvest is a son who causes shame.” (Proverbs 10:5)
Let’s stay diligent in our work. Have questions for a future episode? Leave a comment or send them in. We’d love to hear from you.
Have questions about what this means for your own plan? Reach out to our team, we’re glad to talk it through.
Stay Connected
Have questions or topics you’d like us to cover in a future episode? Email us at contact@thelifegroup.org with “Life in the Markets” in the subject line.
✅ Like, comment, and subscribe on YouTube
🎧 Listen to the audio podcast wherever you get your shows
📘 Pick up a copy of The Good Steward to grow in your financial discipleship
Disclaimer: The topics discussed here are for informational purposes only and do not constitute specific investment advice. Investing involves risks, including potential loss of principal. Past performance does not guarantee future results. Securities and advisory services offered through Geneos Wealth Management, member FINRA/SIPC.